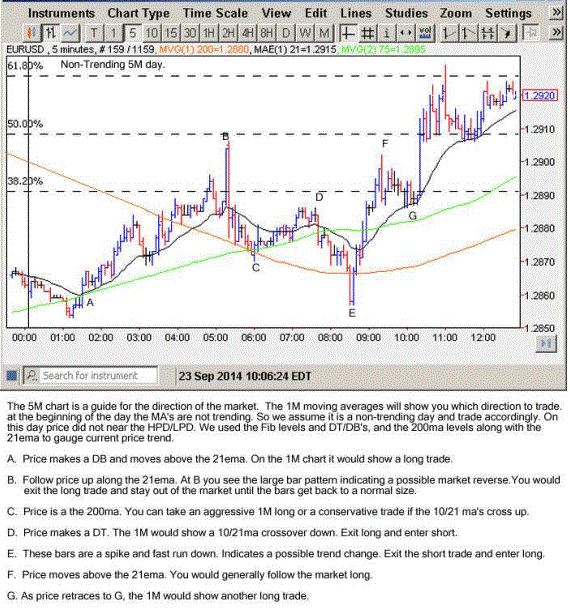
Scalping Day tools
The major support and resistance levels and patterns we will use on the 5M chart are:
A. The High and Low of the Previous Day.
B. Fibonacci Levels drawn from the High and Low of the Previous Day.
C. The 200ma. (Only on entry when no other levels are near)
D. The 75ma and the 21ema to gauge trend.
E. The Fast Run Up/Down price move and the large bar/spike bar move, which indicate a
possible trend change.
The priority of the levels from strongest to weakest are as follows:
Strongest Levels:
High Previous Day and Low Previous Day.
Fibonacci levels.
Weakest Level:
200ma (used only for starting a trade if no other levels are near)
Test of Support and test of resistance.
MA’s:
21ema is stronger than the 75ma.
Strongest Entry and Exit Patterns:
Large bar and Spike bar.
If Large bar or Spike bar is preceded with Fast Run Down or Fast run Up.
Weaker Entry and Exit Patterns:
Fast Run Down and Fast Run Up with no Large or Spike Bar.
As price nears these levels we note what price does at these levels. It may start a move with the
trend or move counter-trend. It may also do nothing. The 75ma/21ema are not levels. They are
guides to know if the market is trending and how much it is trending. This information can be used as when the market is in a trend, as the old saying goes, we do not fight it. Meaning we trade in the
direction of the trend. The 200ma is used only to initiate a trade if not other levels are near. It is also
used to note if the market is on the Bullish or Bearish side. If price is above the 200ma it is Bullish. If price is below the 200ma it is Bearish.
The charts below are examples of the 5M levels and patterns. Our trading runs from midnight to
noon Eastern Time.
Trending Day:
A. When the market is trending it is best to trade with the trend and wait to see if the trend
changes at a major S/R level. Many times the trend will continue past all levels. But note that a start
of a trend will usually start at one of the major S/R levels. The 21ema and the 75ma are used mainly
on these days for trade entry.
Non-Trending Days:
A. We use S/R levels to initiate a trade. The DT/DB pattern is used for confirmation
Range Days or times:
A. If price on the 5M makes two tops and two bottoms near each other the market has
moved into a range. Another way to look at it is a DT and a DB or vice versa. Enter
and exit quickly at the tops and bottoms of the range. Once a range has started d not
trade 10/21 crossovers. Trade only aggressive trades or stay out. Conservative trades
will not make any profit in a range.
Previous Days High and Low Levels: (Strongest S/R level)
A. Draw lines on the current days chart from the high and low of the previous day. The
previous day is from midnight to midnight. So if the current day is September 23 you
would draw the lines from midnight on the 22 nd to midnight on the 23 rd .
B. Price can be 15 pips or less on either side from the HPD/LPD and be valid if price
reverses, or passes the HPD/LPD. Best for Counter-trend moves.
Fibonacci Levels:
A. The extreme Fib levels are the strongest. They are the 38.2% and the 78.6% Fibs.
However price can hit any Fib level and reverse. Best for C/T moves.
B. Price can be 4 pips or less on either side of the Fibonacci Level. Best for 1 st entry only.
200ma:
A. The 200ma works effectively to initiate a trade when no other levels are near only. It is
also good to note if the market is bullish or bearish.
Double Tops/Bottoms:
A. These are common technical patterns that are used in trading. They can be seen all
over the chart. They are most important when used with a level or for a possible trend
change on a non-trending day. A double top is shaped like a ‘M’ and a double bottom
is shaped like a ‘W’. See the Introduction to Technical Analysis in the back of the
Introduction to Forex bonus ebook included for examples.
Fast Run UP/Down Patterns:
A. These patterns are seen most of the time a price makes a quick attempt to reach a
major level. Most of the time they indicate a possible trend change. We need to be
watching for these patterns as price nears a major S/R level.
Scalping day
4/
5
Oleh
Piratebay


