Showing posts with label Momentum Forex Strategies. Show all posts

Sunday, December 20, 2015

CCI Impulse Trading

CCI Impulse Trading is a trading system of trend-momentum based on the CCI (Commodity Channel Index).
The purpose of this strategy is to capture the first impulse of a movement.
This simple technique may achieve this goal of capturing the first impulse of movement.
This technique is suitable to have a goal of pre-determined price, since the ratio stop loss / profit is> 1, then it can be successfully applied in trading binary options high / low. Expiry time for Binary High/low is 3 candles).
Time Frame: 30 min or higher.
Financial market:any.

Indicators used:
CCI 14 period (close, with levels 0, 80, -80,).
50 EMA, Exponential moving Average, to determine the direction of the trend and trade.

Trading rules CCI Impulse Trading
Trades only in the direction of the trend.

Buy
Price close above EMA 50.
CCI crosses upward zero level.

Sell
Price close below EMA 50.
CCI crosses downward zero level.

Exit position when the CCI come back at 80 level (for buy) /-80 level (for sell) or with predetermined profit target that depends by currency pair, the time frame (example H1 Time Frame 20 pips USD/JPY, EUR/USD, AUD/USD, GBP/USD, NZD/USD ) and volatility of the market.
Initial stop loss 5 pips below/above of the entry bar after n..pips in gain for example H1 16 pips move stop loss at the breakeven.
Time Frame and  Profit for majors:
30 min 15 pips
H1 18-22 pips
H4 25-30 pips
Daily 80-120 pips

In the examples we shows the CCI Impulse Trading applied at the USD/JPY.
In the third example you see this strategy applied at the binary/options high/low.
CCI Impulse Trading

CCI Impulse Trading

CCI Impulse Trading applied in trading binary options high

Saturday, December 5, 2015

RSI with Moving Averages tool for trading

RSI removes volatility and gives signals flowing along with moving averages.
This tool for trading is constructed as follows:
2 moving averages on the price (7 simple and weighted 34) and two moving averages on the indicaatore RSI (4 smooted 21 and weighted).

Trend up
The 7 period Ma on price si above of the 34 Ma on price and
the 4 period MA on RSI is above of the 21 period on RSI.

Trend is down
The 7 period Ma on price si below of the 34 Ma on price and
the 4 period MA on RSI is below of the 21 period on RSI.

Trend is sideways up
The 7 period Ma on price si above of the 34 Ma on price and
the 4 period MA on RSI is below of the 21 period on RSI.

Trend is sideways down
The 7 period Ma on price si below of the 34 Ma on price and
the 4 period MA on RSI is below of the 21 period on RSI.

Time Frame 4H or Higher.
RSI with Moving Averages tool for trading


Another way of interpreting this technique and to add to the Levels of 60 and 40.
The area between these two levels is defined: the lateral area.
New trading rules.
Buy RSI above level 60.
Sell below the level 40 of the IHR.
If RSI is between 40 and 60 not to trade.

Example trend up
The 7 period Ma on price si above of the 34 Ma on price and
the 4 period MA on RSI is above of the 21 period on RSI.
RSI above 60 level.

Example trend down
Trend is down
The 7 period Ma on price si below of the 34 Ma on price and
the 4 period MA on RSI is below of the 21 period on RSI.
RSI below 40 level.
RSI with Moving Averages tool for trading


Thursday, November 26, 2015

CCI Trend Continuation

CCI Trend continuation is a simple trading system based on two Commodity Channel Index indicators.
Time Frame: any.
Financial Markets: any.

Setup CCI
Commodity Channel Index (14 period, Tipical price HLC/3, levels: 90, 0, -90)
Commodity Channel Index (50 period, Tipical price HLC/3 levels: 90, 0, -90).

Trading ony in the direction of the Trend.
CCI >0 trend is up.
CCI<0 Trend is down.

Long Entry
CCI 50 >0
CCI 14 crosses upward zero line from the bottom -90

Short Entry
CCI 50 >0
CCI 14 crosses upward zero line from the bottom -90

Exit position with predetermined profit target and fixed stop loss and breakeve stop that depends by Currency pairs and time frame.

Idea for trading.
Build an Expert Advisor whit the previous rules and apply it to the London and New York sessions or parts of sessions.
Time Frame 30 min
Time application of robots.
9:00 22:00

Time Frame 15 min
GMT Berlin
Time application of the EA.
9:00 24:30
16: 00-22: 00
What are the best days to apply automated strategies intraday?
The days when the distance between thepivot pionts is greater or equal to 25 pips.
CCI Trend Continuation

Wednesday, July 15, 2015

Ema with Momentum

EMA   with momentum is trend momentum trading system.
Currency pairs: Majors and Minor.
Time Fraame 30min or higher.
Indicators:
Stochastic indicator (8, 3,3,),
Momentum (8),
EMA 21,
EMA 86,

BUY WHEN:
 The white Candlesticks are ABOVE the 2 EMA lines (Yellow and Gold).
(Section 1)
 The momentum line is BELOW 100 BUT positively starting to move UPWARDS.
(Section 2) Stoch Blue line starts to climb ABOVE the red line, at a sharper angle.
(Section 3).

SELL WHEN:
The white Candlesticks are BELOW the 2 EMA lines (Yellow and Gold).
(Section 1)
 The momentum line is ABOVE 100 BUT positively starting to move
DOWNWARDS. (Section 2)
 Stoch Blue line starts to fall BELOW the red line, at a sharper angle.
(Section 3)
 Stop levels and Take Profit levels depend on the timeframe you are using.
 If you wish to scalp (highly effective) Then I suggest the M5 chart with a TP of 10 pips and a stop of 7 pips.

Saturday, April 18, 2015

Traditional MACD filtered with RSI

Traditional MACD with RSI is a simpe and effective trend momentum trading System. This system is based on The MACD oscillator is have created by Gerald Appel . The MACD line is the difference between a "fast" EMA and a "slow" EMA. The Signal line is an EMA of the MACD line. In this strategy we have also the RSI for to filter the crossover signals of MACD.
Markets: Forex Majors and Index.
Time Frame 30 min, 15 min.

Indicators:
Traditional MACD: (34, 48, 30).
RSI (14, close) with level 55 and 45.

Trading rules Traditional MACD with RSI

Buy
When MACD crossing upward and RSI is > 55.

Sell
When MACD crossing Downward and RSI is < 45.

Exit with profit target od 20-25 pips depends by currency pairs.
Initial stop loss on the previous swing.

Vantages:This trading system is very simple and profitable ad you can use all platforms for trading.
Disavantages: In sidewais market It can generates false signals.
Traditional MACD filtered with RSI

Traditional MACD filtered with RSI


Thursday, April 16, 2015

Double Stochastic Trading

Double stochastic trading is a momentum strategy based on two stochastics oscillators. The first fast, the second slow. The slow stochastic is the as the filter.
Time frame 30 min or higher.
Markets: Currency pairs, Indicies Commodities and Stocks.

Indicators:
Fast Stochastic oscillator ( 11, 3, 3, close).the crossover determines the entries in the direction of the trend.
Slow Stochastic oscillator /21, 9, 9, close).IT determines the direction of the trend.

Trading Rules Double Stochastic Trading

Trades only in the direction of the major tred that determines the crossover of the slow Stochastic.

Buy
Slow stochastic crosses upward below 50 level.
Fast Stochastic crosses upward and you can use for re-enter buy.

Sell
Slow stochastic crosses downward above 50 level.
Fast Stochastic crosses downward and you can use for-re-enter sell.

Exit at the cross of the slow stochastic line or at the leves of Support or resistance or reccomended with profit target predetermined that depends by currency pair of the time frame.

Adantages: Good entries with simple esecution.
Disanvantages: needs constant watching, because is a lagging oscillator also if stochastic is fast.
Double Stochastic Trading

Tuesday, April 14, 2015

Stochastic Oscillator with trend line

Stochastic oscillar with trend line is a trend momentum trading system. Time Frame any but  4H or daily recommended.
Markets: Currency pairs, Commodities and Indicies.
Indicators: Full Stochastic (14, 3,3, close).
Too:l trend line.
Trading rules Stochastic oscilllator with trend line
Draws on the chart trend line. (find chart in trend this is a basic condition). trades only in direction of the trend.
Buy
Oscillator stochastic reached oversold area below level 20 and after reached level 10 when exit from oversold zone and crosses upward 20 level you make a buy order.
Sell
Oscillator stochastic reached overbought area above level 80 reached 90 level  when exit from overbought zone and crosses downward 80 level put a sell order.
Advantages: With the trend line on the chart to eliminate many of false signals. This strategy is very simple for trading.
Disanvantages: The stochastic indicator can generate many false signals. Tracing a trend line requires experience. How to draw a trend line
Stochastic oscillator with trend line


Stochastic with trend line


Wednesday, April 8, 2015

Smartfx strategy 

Simple yet profitable strategy Smartfx strategy.
Trend-Momentum strategy.
Time frame only30 min time frame.
Currency pairs: majors (EUR/USD, USD/CHF, AUD/USD, AUD/NZD, NZD/USD, GBP/USD, GBP/JPY, USD/CAD, USD/JPY,)
Indicator:( Relative Strength Index 21 period, close).

Smatfx trading Rules
Long Entry
Buy when the RSI crosses above and candle closed and stop loss below the cross over candle

Short Entry
Sell when the RSI crosses below and the candle closed and stop loss above the cross over candle.

Close position: discertionary
Disadvantage: This strategy works best in trending in ranging markets lot of false signals.
Advantage: very simple.
Smartfx strategy 
Smartfx Strategy

Wednesday, March 25, 2015

RSI Stochastic with Bollinger Bands

The two indicators I will be using are Bollinger Bands and stochastic relative strength index (StochR SI ). StochRSI , which combines the features of stochastics and RSI , was
detailed in Tushar S. Chande and Stanley Kroll’s book, The New Technical Trader. I selected this combination because it is a useful way to determine when prices will stop tagging a Bollinger Band and are likely to move all the way from one band to the next. Of course, those prices may not move all the way, so you will need to use stops for protection. You will also want to use a simple money management strategy of allocating only a portion of your capital to any one position.
First, let’s take a look at R SI and StochRSI . Stochastics, you will recall, is simply a way of measuring, for a given period of time, where today’s close is relative to the lowest low, and where within the range of the highest high and lowest low the price falls over the same time period. The formula for stochastics for a 14-day period is:
Today'sclose– Lowestlowofthelast14 days/
Highesthighofthelast14 days– Lowestlowofthelast14 days

Note the use of range — high minus low — in the denominator of the calculation.
Many trading techniques and strategies are built around range in some form, and if you use several indicators, you want independent sources, so that the indicators independently confirm one another.
Independent confirmation is one part of Dow theory you should consider embracing. For example, Larry Williams’ %R is the reverse of stochastics, substituting the difference of highest high
over a given period minus today’s close for the numerator. So if you want to use this indicator together with stochastics, you are not using independent indicators.
Instead, you should consider using an indicator that does not involve a range, such as volume, or one that is statistical in nature, such as Bollinger Bands.
The next step is to identify the type of stock that will work best. If you are going to use an indicator that relies on price volatility such as StochR SI , then you should examine your charts to see the
nature of the current volatility. For example, I have used AOL Time Warner (AOL ) in Figure 1. What differentiates the four areas (A, B, C, and D) is the combination of price and volume
volatility. Area A has low price and high volume volatility. Area B has both high price and volume volatility. Area C has high price volatility, and low volume volatility for the stock.
Finally, area D has moderate volume and price volatility. A useful rule to remember is that a price is “in gear” — that is, in sync — if price goes up on high volume or down on lowered volume. Prices that reflect such moves are prices that the market is comfortable with. If you were long in area A or

short in area D, you would have done well. A trading system designed for areas A and D — “ingear” moves — is likely to have a terrible time in areas B and C. As you will discover shortly, AOL represents the good, the bad, the ugly, and the really ugly when it comes to using a trading system that only takes long positions.
Stochastic RSI Trading System
IGURE 1: DAILY AO L PRICE AND VO LUME. Price volatility is less before June 1998. For indicators that use price volatility such as StochRSI, you want to use fewer periods in the calculation to generate trading signals than you would prior to June 1998.
Stochastic RSI VS RSI
RSI VS . STOCH RSI If you compare RSI and StochRSI measurements over a few months, you
will notice a difference: One of them will hit the extreme faster and tend to stay near the extreme better than the other. The formula for StochRSI for a 14-day period is:
RSI– LowestRSIoverthelast14 days/
HighestRSIoverthelast14 days– LowestRSIoverthelast14 days

If you build this indicator, of course, you can make the RSI use a 14-day period or you can, for example, make the RSI based on a nine day period and retain the 14 days for the stochastics portion. As you can see from Figure 2, StochRSI does a better job of hitting its extreme and staying there than R SI does. StochR SI allows you to draw a line that acts as a threshold line better than RSI (black lines drawn within green boxes). While bothRSI and StochRSI range between zero and one — although cosmetic adjustments are made to RSI so it appears to range between zero and 100 — StochRSI hits its extreme faster because you are only looking at the RSI over a recent lookback period. Still, there are times, as in April, when StochRSI gives you a mixed message.
This is where Bollinger Bands can help. If you overlay price with Bollinger Bands, as in Figure 3, you begin to get an idea of the setup for a long position:
Act when prices are tagging the lower band (point A) with a move up (point B), while StochRSI shows a significant gain in value (point C). However, this setup has potential problems for long trades; look at the red box in the chart. In April and May 2000, you have examples of prices tagging the lower band and then closing above. In one instance (event D), StochR SI would potentially give a confirming signal that you should go long, but then prices go back down to the lower band. This is an example of the problem I referred to earlier, that low volume is often
Stochastic RSI VS RSI
FIGURE 2: DAILY AO L PRICE AND VO LUME 2000 WITH RSI (TOP CHART) AND STOCHRSI (SECOND FROM TOP CHART). StochRSI not only responds quickly to price changes, but also hits its extreme and stays there better than RSI (see green boxes); 14-day periods are used for both RSI and StochRSI.


accompanied by randomness. Note that volume in late April and May is significantly lower than in the preceding time frame. I will try to incorporate some rules into the trading system to account for this, but in such a situation it is often best to exit and find another stock.
I will now execute a trading system, without stops and money management, to see what it can do. The trading system is going to have the following trading rules for a long position:
Stochastic RSI Trading
FIGURE 3: DAILY AOL AND VOLUME AND STOCHRSI (UPPER CHART): FEBRUARY/JUNE 2000. A 20-day, two standard deviation Bollinger Band is overlaid on the price chart. On the left hand side is a setup that promises to enter a long position. It starts with prices tagging the lower band, event A. Prices close above the lower band, event B, and at the same time StochRSI has moved up to a value of 0.4, event C. What is distressing is the action in the red box, especially in view of event D, a spike in StochRSI and a close above the lower band followed by a retreat of prices. But if you look at volume below, the problem mentioned earlier is obviously apparent: low volume giving you a random price movement.
Entry:
1 Look for prices tagging the lower Bollinger Band
2 Look for a closing price of an up day, that is (close>open), that is above the lower band after having prices follow (1)
3 Volume of this up day should be greater than the volume of the previous up day
4 StochR SI should be above a threshold to ensure some momentum is associated with the push up
5 The (close-open)/(high-low)>0.2, to avoid days that have short candlestick bodies.
Exit:
1 StochR SI should be less than a threshold to assure loss of momentum
2 Look for prices to reach the upper band
3 Closing price should be near the top Bollinger Band.

You are looking for the stock to continue up if it has been tagging a lower Bollinger Band and then made a convincing move up, so that it conforms to entry rules 2 through 5 above. I used weighted closes in calculating the Bollinger Bands:
(2*close+high+low)/4.
From Figure 4 you can see that investing $1,000 in 1997 and using this trading system without stops resulted in $58,000 (second chart from top), which beat buy/ hold by more than $47,000. However, there are serious drawdowns in each of the areas B, C, and D. The only factor that varied in this trading system was the number of periods for StochRSI and Bollinger Bands. When using the initial version of this system I optimized the StochR SI thresholds as well. The equity looked better in terms of drawdowns and ended up with $300,000+, which led me to believe that there might be something to this approach.
Optimizing on everything — from periods to thresholds — results in spectacular equity performance (Figure 5), and although it is curve-fitting, it shows the potential you are trying to
achieve. It also shows the trading system is biased to take advantage of strong
uptrends: During uptrends, prices that tag the bottom Bollinger Band will
FIGURE 4: DAILY AOL AND VOLUME WITH EQUITY PERFORMANCE. Starting with $1,000, a trading system that goes long using Bollinger Bands and StochRSI is seen to have four trading behaviors, as indicated by areas A, B, C, and D. Note the equity scales are X10. The second chart from the top is the equity performance without stops. In area
A, the system makes little money despite rising prices, breaks even in B, has a better performance in C, and then performs poorly during D. Even area C is not especially appealing because you are faced with serious drawdowns, unless you use stops (as seen in top chart). The top chart, using maximum stop-losses of 5%, provides better performance.
move to the upper band, resulting in a trading system that can do much better than buy and hold. But letting thresholds optimize curve-fits the performance too much, so I set the thresholds visually. To get rid of the serious drawdowns, I used maximum loss stops of 5%, which improved the equity performance (Figure 4: top chart). Still, area B just eats away at your equity, although it does appear I took care of the low volume problem in area C.
FIGURE 5: DAILY AOL AND VOLUME WITH EQUITY PERFO RMANCE FOR AREA A. A $1,000 equity investment reaches $45,000+, while buy and hold reaches $20,000+. While this kind of equity performance (top chart) is spectacular, it comes from letting all the variables in the trading system be optimized — curve-fitting. What this shows, however, is the potential of the system if the periods and thresholds are chosen correctly, along with the right (strong uptrend) price movement. It also reflects the bias of the trading system, which takes advantage of the fact that in a strong uptrend, prices that tag the lower Bollinger Band do so only briefly.
Reference :
Stocks and Commodities Developping a Trading System by Dennis Peterson.

Monday, March 23, 2015

CCI and Momentum Intraday Trading

CCI and Momentum trading is an intraday system will shortly explain all the indicators we will be using. Time Frame 15 min or 30 min. Currency pairs: majors.
Momentum
The Momentum indicator is a speed of movement (or rate of change) indicator, that is designed to
identify the speed (or strength) of a price movement. In other words you should be buying when the price is picking up momentum and selling when that momentum has been lost.
We use Momentum with period 60, computed from typical price. The rule is that we go long only if the Momentum is higher than 100, and go short if Momentum is lower than 100.
Commodity Chanel Index – CCI
The Commodity Channel Index indicator is based on an observation that the market moves in cyclical movements which means high and low of the price are coming in periodic intervals and in
consecutive fashion. So, if we can detect those cycles we can detect the beginning and the ending
of the trend. CCI is used to help identify price reversals, price extremes and trend strength.
We use CCI with period 60, computed from typical price.
Entering the trade
As I said earlier, our trading time is 5:30am GMT time. You should get to the computer about 5
minutes before 5:30 and wait until the candle finishes.
For indicator values, you should check the chart at a close of 5:15am candle at 5:30am.
I use Alpari UK broker, so 5:30am GMT is 7:30am in broker time that you see on the charts.
LONG signal
We will go LONG (buy) if and only if ALL the following conditions are met:
1. Momentum(60) of the 5:15am candle is higher than 100 AND lower than 100,8 (in other
words between 100 and 100,8)
2. CCI(60) of the 5:15am candle is higher than 0
Then we will buy at Market price.
CCI and Momentum Intraday Trading


We can see that Momentum is above 100 (but below 100,8) and CCI is also above 0, so we enter
Long by Market price.

SHORT signal
We will go SHORT (sell) if and only if ALL the following conditions are met:
1. Momentum(60) of the 5:15am candle is lower than 100 AND higher than 99,2 (in other
words between 99,2 and 100)
2. CCI (60) of the 5:15am candle is lower than 0
Then we will sell at Market price.
Example

We can see that Momentum is below 100 (but above 99,2) and CCI is also below 0, so we enter Short
by Market price.
NO TRADE
We will NOT TRADE for the day if some of the conditions are not met.
For example Momentum >100, but CCI < 0; or if Momentum > 100,8
Example
At 22 July 2010, you can see that the conditions to enter either long or short were not filled.
Momentum is below 100, but CCI is above 0.
We will always use fixed Profit Target 40 pips and fixed Stop Loss 40 pips. After we enter the trade,
we don’t manage it; we simply wait until it hits profit or loss. You can leave the computer and check
the result in the evening or next morning.
ALWAYS DOUBLECHECK that you have set your Stop Loss and Profit Target properly before leaving the computer!

Money Management
Rule1
Always use Stop Loss.
Stop Loss (SL) is an order that will tell the system to cancel the trade at the given loss, if the market is going against us. This way it protects us by keeping our loses defined and small. Trading without SL or moving SL will eventually lead to account wipeout.
If the market is going against us, we should simply accept the small loss and quit the trade. All trading systems are based on probability or some edge. There is no system that will only win. Losses are a part of the trading, and what matters is the positive result at the end of the month or year, not today’s loss.
Stop Loss of 40 pips, so you will never lose more than 40 pips on one trade.

The general rule for any system is to NOT risk more than 2 % of your trading account on one trade.
This means that if you have account with $2,000 capital, you should risk maximum 2% of it on one
trade, which is $40.
Because our Stop Loss is always 40 pips, you can trade Forex Morning Trade with 0.1 standard lot
(which is 1 minilot, and 1 pip is $1).
If you have account with $ 10,000 capital, your 2 % risk is $200. Because our Stop Loss is always 40 pips, you can compute the lots size using the formula: Minilots = (risked amount) / (SL in pips).
In our case: $200/40 pips = 5 minilots (which is 0.5 standard lots and 1 pip equals to $5)
So, with $10,000 capital and trading 0.5 lots, if Forex Morning Trade System wins, you’ll earn $200, if it loses, you lose $200.
A good rule to remember: if I use 0.1 lot, then 1 pip = $1. If I use 0.2 lots, then 1 pip = $2 and so on.


Friday, March 20, 2015

Quantum Trading

Most new trading just doesn’t like to wait for a complete and perfect trade to take place. These types of short term traders would be very happy to get into multiple trades per day for 10+ pips profit for each trade. Rather than opening one trade per day and wait until price hits the 100+ pips target.
Momentum trading or short term system is the best forex trading strategy that they can use. But with the Quantum system we are also going to include medium term or long term trading as well. The reason for that is while short term trading is the favorite strategy for new traders, they won’t be beginners forever! And soon they will feel the need to trade more professionally for larger profits.
And instead of looking for another trading system, you will find long term trading strategy within this system as well as the momentum – short term – strategy.
hort term trading…
Best to be used with 5M , 15M , 30M and 1H time frames.
Trading rules:
When the 24 EMA cross above the 124 SMA, wait until a blue bar is formed above or below the 0 line of the A.O indicator – best if it’s above the 0 line. When that happens, open a BUY Order and set your stop loss at the last support level or 75 pips.
Your exit sign would be a red bar formed above or below the 0 line of the A.O
indicator.

Example:
Quantum trading
The opposite conditions are used for sell orders.
When 124 SMA cross the 24 EMA, wait until a new red bar is formed above or below the A.O indicator. Best if it’s below the 0 line. When that happens, open a sell order and set your stop loss at the last resistance level or 75 pips.
Your exist sign is when a new blue bar is formed above o below the 0 line of the
A.O indicator.
Example:
Quantum trading

Long Term Trading
For long term trading we are going to apply almost the same rules with few changes.
For sell orders, only sell when the red bar is formed below 0 line + 124 MA cross
above 24 MA.
And only exit when a blue bar is formed above the 0 line + 24 MA cross above 124 MA.
Example:
Quantum Trading - momentum strategy
Notice how with this strategy you could get a lot more profits, if you can wait! And for buy orders, only buy when the blue bar is formed above 0 line + 24 MA cross above 124 MA.
And only exit when a red bar is formed below 0 line + 124 MA cross above 24 MA.
Example:
Quantum trading - Momentum Strategy

Tuesday, December 2, 2014

CCI retracement trading

CCI retracement tradingis a trend-momentum strategy. This trading system is very symple and higly accurate.
Time Frame 5 min or higher.
Markets: Forex and Indicies.

Indicators:
commodity channel Index (CCC, 25 period);
Simple moving average (SMA, 200 period).

Trading rules CCI retracement trading
Long Entry
The current price will be above 200 simple moving average and buy when Commodity Channel Index 25 gets -100 level.

Short Entry
The current price will be below 200 simple moving average and sell when Commodity Channel Index 25 gets -100 level;

Profit Target 40 pips, Initial stop loss on the previosu swing high/low or Stop loss 40 pips, Risk, ratio 1:1..
CCI Retracement Trading

CCI retracement trading


Saturday, November 22, 2014

Detrend Forex Trading System

Detrend Forex Trading System is a momentum strategy.
Time Frame 60 min or higher.
Currency pairs: majors (only 60 min time frame) or higher time frame.

Indicators:
Simple moving average 3 period close;
Simple moving average 15 period close;
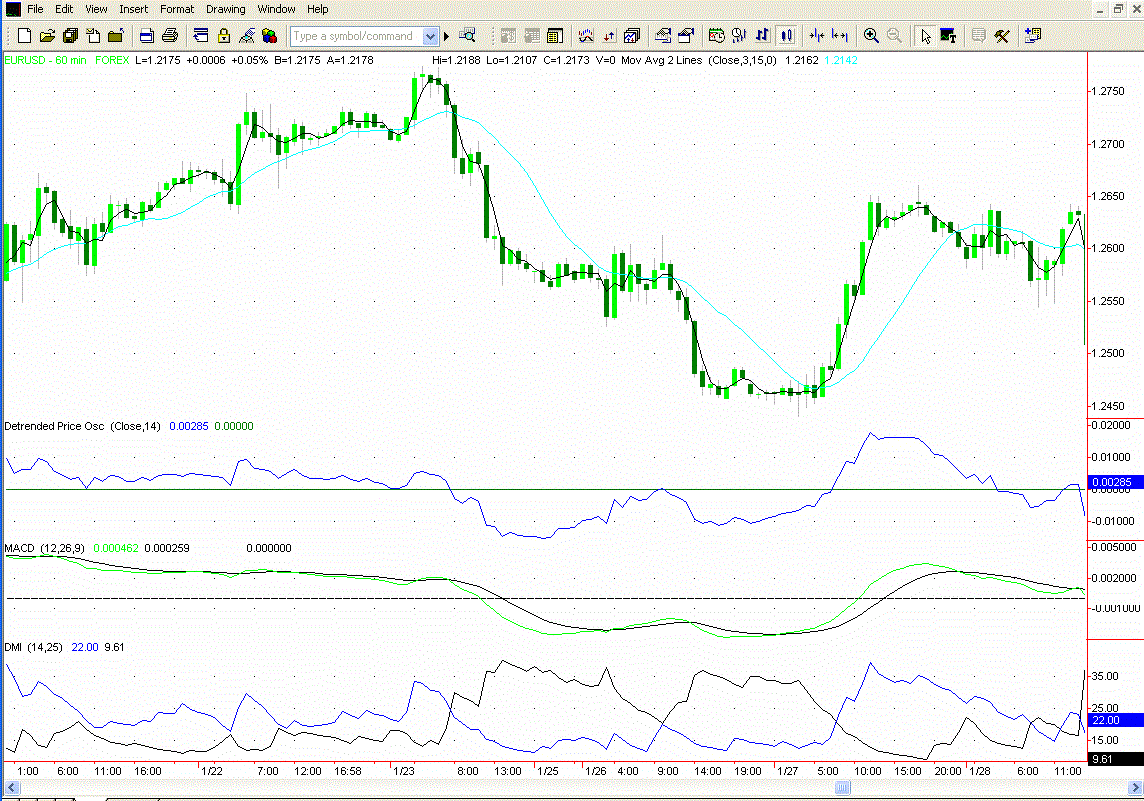
Detrend Indicator (DPO) 14 period close;
ADX (14 period close, with 25 level);
MACD (default setting: 12, 26, 9).
See setting in the picture below:
In the above chart, the black MA is the 3 day, and the light blue MA is the 15 day. When
using the 3/15 cross, a buy confirmation is when the 3 day crosses above the 15 day, and a
sell confirmation is when the 3 day crosses below the 15 day. (Please see above chart) For
us to take a signal from the DPO, when the confirmation from the MACD and DMI
(optional) is there, the 3/15 must confirm the trade by crossing up to 3 candles before or
after the DPO crosses the zero line. Let’s say the DPO crosses above the zero line and that cross is confirmed by the MACD and the DMI, and then on the same candle the 3/15 crosses also, or on the 2 nd or 3 rd candle after the DPO crosses the 3/15 crosses, this is a valid signal. If on the other hand the 3/15 cross first, (which occurs much more frequently) and we get a signal on the DPO on that candle or the second or third candle after the cross of the 3/15, then that is a valid confirmation. In the above chart, both of these examples of the 3/15 cross is a perfect example of a valid sell signal, and then a valid buy signal,
confirmed by all indicators at the same time.

Rules Detreend forex trading System

Long Entry
1 The Detrend indicator cross above the zero line.
2The MACD line must be above the signal line.
3 The +DI should be above the –DI or just be crossing above the -DI. (As you learned, this is not 100% necessary, but preferable.)
4 the 3 MA must cross above the 15 MA up to 3 candles either
before or after the upward cross of the Detrend Indicator.

Short Entry
1 The Detrend indicator cross below the zero line.
2 The MACD line must be below the signal line.
3 The +DI should be below the –DI or just be crossing below the -DI. (As you learned, this is not 100% necessary, but preferable.)
4 Finally, the 3 MA must cross below the 15 MA up to 3 candles either
before or after the upward cross of the Detrend indicator .

Exit Position (EUR/USD 60 min)
Place your stop loss 10 pips below the 15 MA on a long trade or 15 pips above the 15 MA on a short trade, OR put the stop at 30 pips, whichever is closer. (35 – 40 on the EUR/USD)
Continually trail the stop 10 pips below the 15 MA on a long trade or 15 pips above the 15 MA on a short trade, as the currency moves in your favor.
Once you are up 50 pips, move your stop loss to your entry point. Leave the stop loss at your entry
point for the duration of the trade.
Exit the trade when the 3 MA crosses below the 15 MA if you are long, or when the 3 MA crosses above the 15 MA if you’re short.
This is an example of a buy signal on the USD/CHF that was not confirmed by the DMI. If
you look closely, at the time of this trade the +DI had not yet crossed above the –DI. It was
still below it, however the +DI and –DI were converging very close together, and the DPO
had crossed 2 candles after the 3/15 cross, and the MACD confirmed the trade, so it was
okay to take this signal. Had the two lines of the DMI still been very far apart and widely separated you would want to pass on the trade. This ended up being a very profitable trade. It is important that when exiting the trade, you wait for the 3 to fully cross the 15 MA, because as you can see by the area that is circled on the chart, they nearly crossed but didn’t quite cross in the middle of the trade, and the currency ended up moving quite a bit further before the 3/15 finally crossed, confirming the exit of the trade.
Bought – 1.2447
Stop Loss – 1.2410 (37 pips, 10 pips below the 15 MA)
Sold – 1.2656
Profit – 209 Pips
Detrend (DPO) Forex Trading System
Here is an example of two short trades on the USD/CHF, one right after the other. They
were both good trades, confirmed by all indicators simultaneously.
First Trade:
Sold – 1.4133
Stop Loss – 1.4177, 40 pips (Also 15 pips above the 15 MA)
Bought – 1.4067
Profit – 66 pips
Second Trade:
Sold – 1.4028
Stop Loss – 1.4063, 35 pips (15 pips above the 15 MA)
Bought – 1.3876
Profit – 152 pips

Thursday, November 20, 2014

Stochastic power ranger trading system

Stochastic power ranger trading system is a momentum strategy.
Time Frame H1 or higher.
Currency pairs: majors at the H1 time frame.
Stochastic power ranger trading system is based on the concept that a range will form after the market finishes trending. We use the stochastic to give us an indication of a possible range formation. We also rely on the current market momentum to tell us when to go long or short. If the market is moving in an uptrend, we look to go long in the range. The entry is determined by the
oversold region (below level 20) of the stochastic.
If the market is moving in a downtrend, we look to go short in the range. The entry is determined by the overbought region (above level 80) of the stochastic. We use the most recent high and low to determine the possible resistance and support of the range.
This strategy has two profi t targets, and we take the fi rst profi t target within the range. The second profit target.

Rules Stochastic power ranger
Long Trade Setup
We use EUR/USD on the H1 time frame to illustrate a long trade. Here are the steps to execute the Stochastic power ranger strategy for long:
1. Draw an uptrend line based on a series of higher highs and higher lows. (See Figure 1 .)
2. On the stochastic, look for %K and %D to go below level 20 (oversold). (See Figure 2.)
3. Determine the support and resistance of the range. Enter long once the stochastic crosses above level 20.
4. Set the first profi t target at the 75% mark of the range. Set the stop loss at a risk to reward ratio of 1:1, and set the second profit target at risk to reward ratio of 1:2. After calculation, the stop loss must be below the support level. If not, the trade is considered invalid. (See Figur3 .)
Stochastic power ranger trading system
1

2

3

Stochastic power ranger trading system
from the long example in Figure 4 :
Entry price = 1.2919
Stop loss = 1.2877
Profit target 1 = 1.2961
Profit target 2 = 1.3003
The risk for this trade is 42 pips, and the reward is 84 pips if both targets are hit. The risk to reward ratio is 1:2, which yields a tidy 6% return if we take a 3% risk.

Short Trade Setup
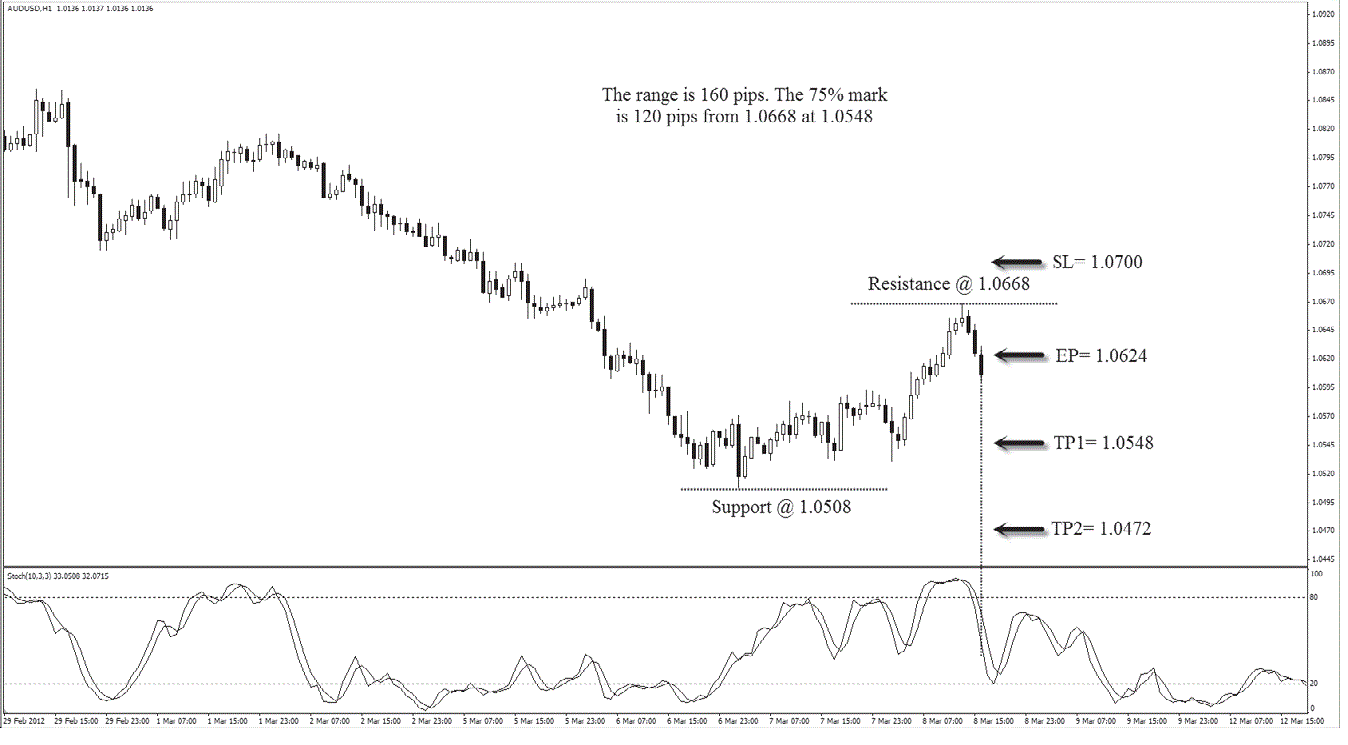
We use AUD/USD on the H1 time frame to illustrate a short trade. Here are
the steps to execute the power ranger strategy for short:
1. Draw a downtrend line based on a series of lower highs and lower lows. (See Figure 5 .)
2. On the stochastic, look for %K and %D to go above level 80 (oversold). (See Figure 6 .)
3. Determine the support and resistance of the range. Enter short once the stochastic goes below level 80.
4. Set the fi rst profit target at the 75% mark of the range. Set the stop loss at a risk to reward ratio of 1:1, and set the second profi t target at risk to reward ratio of 1:2. After calculation, the stop loss must be above the resistance level. If not, the trade is considered invalid. (See Figure 7 .)
Stochastic power ranger strategy
5

6

7

Stochastic power ranger strategy
Stochastic power ranger trading system
From the short example in Figure 8 :
Entry price = 1.0624
Stop loss = 1.0700
Profit target 1 = 1.0548
Profit target 2 = 1.0472
The risk for this trade is 76 pips, and the reward is 152 pips if both targets are hit. The risk to reward ratio is 1:2, which yields a tidy 6% return if we take a 3% risk.

Thursday, November 6, 2014

Stochastic Switch

Stochastic Switch system is really simple and works extremely well on the 4-hour
timeframe (but works on other timeframes too!).
Indicators:
Stochastic Oscillator (with 5,3,3 settings)
Stochastic Oscillator (with 30,9,9 settings)
A BUY Trade
When the Stochastic(30,9,9) Main Line is ABOVE the Signal Line we then
look to BUY.
A BUY signal occurs when the Stochastic(5,3,3) Main Line crosses ABOVE

the Signal Line.
Stochastic Switch
Stochastic Switch


Sunday, October 26, 2014

CCI Trade Momentum

CCI Trade is a forex strategy based on Commody Channel Index. CCI is an indicator that is good for measure of momentum and helps us to optimize best entries in the activity of trading on the financial markets.
CCI (Commodity channel Index is an oscillator (mathematical algorithm). CCI is an unbounded range, typically when your level is above of +100 considered to be overbought, when your level is below -100 is oversold.
We will use these levels as our trigger points as we put a twist on the traditional interpretation of CCI. We actually look to buy if the currency pair makes a new high above 100 and sell if the currency pair makes a new low below -100. In “Trade CCI Momentum” we are looking for new peaks or spikes in momentum that are likely to carry the currency pair higher or lower. The thesis behind this setup is that much like a body hurtled in motion will remain so until it’s slowed by counterforces, new highs or lows in CCI will propel the currency further in the direction of the move before new prices finally put a halt to the advance or the decline.

Trade CCI Momentum Buy
1. On the daily or the hourly charts place the CCI indicator with standard input of 20.
2. Note the very last time the CCI registered a reading of greater than +100 before
dropping back below the +100 zone.
3. Take a measure of the peak CCI reading and record it.
4. If CCI once again trades above the +100 and if its value exceeds the prior peak reading,
go long at market at the close of the candle.
5. Measure the low of the candle and use it as your stop.
6. If the position moves in your favor by the amount of your original stop, sell half and
move stop to breakeven.
7. Take profit on the rest of the trade when position moves to two times your stop.

Trade CCI Momentum Sell
1. On the daily or the hourly charts place the CCI indicator with standard input of 20.
2. Note the very last time the CCI registered a reading of less than -100 before poking
above the -100 zone.
3. Take a measure of the peak CCI reading and record it.
4. If CCI once again trades below the -100 and if its value exceeds the prior low reading,
go short at market at the close of the candle.
5. Measure the high of the candle and use it as your stop.
6. If the position moves in your favor by the amount of your original stop, sell half and
move the stop on the remainder of the position to breakeven.

7. Take profit on the rest of the trade when position moves to two times your stop.
CCI Trade Momentum
 In this daily chart of the EUR/USD pair we see that the former peak high above the CCI +100 level
was recorded on September 5, 2005, when it reached a reading of 130.00. Not until more than three
months later on December 13, 2005, did the CCI produce a value that would exceed this number.
Throughout this time we can see that EUR/USD was in a severe decline with many false breakouts
to the upside that fizzled as soon as they appeared on the chart. On December 13, 2005, however,
CCI hit 162.61 and we immediately went long on the close at 1.1945 using the low of the candle
at 1.1906 as our stop. Our first target was 100% of our risk, or approximately 40 points. We exited
half the position at 1.1985 and the second half of the position at two times our risk at 1.2035. Our
total reward-to-risk ratio on this trade was 1.5:1, meaning that if we were merely 50% accurate,
the setup would have positive expectancy. Note also that we were able to capture our gains in less
than 24 hours as the momentum of the move carried our position to profit very quickly.
For those traders who do not like to wait nearly a quarter of a year between setups, the hourly chart
offers far more opportunities of the “Trade CCI Momentum” setup. It is still infrequent, which is one of the reasons that makes this setup so powerful (the common wisdom in trading is: the rarer the trade the better the trade). Nevertheless it occurs on the hourly charts far more often than on the dailies.
In the above example, we look at the hourly chart of the EUR/USD between March 24 and March
28 of 2006. At 1pm on March 24, 2006, the EUR/USD reaches a CCI peak of 142.96. Several
days later at 4am on March 28, 2006, the CCI reading reaches a new high of 184.72. We go long
at market on the close of the candle at 1.2063. The low of the candle is 1.2027 and we set our stop
there. The pair consolidates for several hours and then makes a burst to our first target of 1.2103
at 9am on March 28, 2006. We move the stop to breakeven to protect our profits and are stopped
out a few hours later, banking 40 pips of profit. As the saying goes, half a loaf is better than none,
and it is amazing how they can add up to a whole bakery full of profits if we simply take what the
market gives us.

Here is an example of a short in USD/CHF trade on the dailies that employs this approach in
reverse. On October 11, 2004 USD/CHF makes a CCI low of -131.05. A few days later, on October
14, 2004, the CCI prints at -133.68. We enter short at market on the close of the candle at 1.2445.
Our stop is the high of that candle at 1.2545. Our first exit is hit just two days later at 1.2345. We
stay in the trade with the rest of the position and move the stop to breakeven. Our second target is
hit on October 19, 2004 - no more than five days after we’ve entered the trade. Total profit on the
trade? 300 points. Our total risk was only 200 points, and we never even experienced any serious
drawdown as the momentum pulled prices further down. The key is high probability, and that is
exactly what the “Trade CCI Momentum” setup provides.
At 9pm on March 21, 2006, EUR/JPY recorded a reading of -115.19 before recovering above the
-100 CCI zone. The “Trade CCI Momentum” setup triggered almost to the tee five days later at 8pm on March 26, 2006. The CCI value reached a low of -133.68 and we went short on the close of the
candle. This was a very large candle on the hourly charts, and we had to risk 74 points as our entry
was 140.79 and our stop was at 141.51. The majority of the traders would have been afraid to enter
short at that time, thinking that most of the selling had been done. But we had faith in our strategy
and followed the setup. Prices then consolidated a bit and trended lower until 1pm on March 27,
2006. Less than 24 hours later we were able to hit our first target, which was a very substantial 74
points. Again we moved our stop to breakeven. The pair proceeded to bottom out and rally, taking
us out at breakeven. Although we did not achieve our second target overall, it was a good trade as
we banked 74 points without ever really being in a significant drawdown.
Finally, our last example shows how this setup can go wrong and why it is critical to always use
stops. The “Trade CCI Momentum” setup relies on momentum to generate profits. When the momentum fails to materialize, it signals that a turn may be in the making. Here is how it played out on the hourly charts in AUD/USD. We note that CCI makes a near-term peak at 132.58 at 10pm on May 2, 2006. A few days later at 11am on May 4, 2006, CCI reaches 149.44 prompting a long entry
at .7721. The stop is placed at .7709 and is taken out the very same hour. Notice that instead of
rallying higher, the pair reversed rapidly. Furthermore, as the downside move gained speed prices
reached a low of .7675. A trader who did not take the 12-point stop as prescribed by the setup
would have learned a very expensive lesson indeed as his losses could have been magnified by a
factor of three. Therefore, the key idea to remember with our “Trade CCI Momentum” setup is - “I
am right or I am out!
How can you improve this forex strategy?
adding 2 exponential moving averages.
The new setup of this strategy is as follows (h1 time frame)
CCI 20 periods,
 EMA 9 periods ,
EMA 21 periods.
H4 and daily time Frame setup is:
CCI 20 periods,
 EMA 6 periods,.
EMA 13 periods.

Buy
The same previous rules but with conditions That 9EMA> 21 EMA.
Sell
The same previous rules but with conditions That 9EMA< 21 EMA.

To see example
Trade CCI Momentum
Trade CCI Momentum
For a more aggressive trading this strategy can be summarized in the following way:
Buy
CCI> 100 and 9EMA> 21EMA;
Sell
CCI <-100 and 9EMA <21EMA
Trade CCI Momentum
trade CCI Momentum