Showing posts with label Trend Forex Strategies. Show all posts

Thursday, December 10, 2015

Trading with Force Index

The Force Index developed by Alexander Elder is an indicator that uses price and volume . The Force Index can be used as trending indicator to reinforce the overall trend, for identify corrections of the markets or reversals trend with divergences.
In this trading system we use the Force Index with other indicators of trend.
Time Frame 30 min or higher.

Indicators:
• Moving Average - period 20, simple method, it’s normally above or below the price.
• Parabolic SAR - step 0.02, maximum 0.2, represented by the dots that are also found above or
below the price.
• MACD - fast ema,12, slow ema ,26, Macd sma ,9,
• Force Index - period 13, simple method.
MACD and Force Index are shown in two separate windows below the chart see picture.


Buy
The Moving Average should be below the price and point up;
The dot of the Parabolic SAR should be below the price;
MACD crossover upward below the ‘zero line’;
The Force Index should be point up.

Exit buy
Exit when the Parabolic SAR changes direction an is above the price, or also exit when the MACD crossover above the ‘zero line’.


Sell
The Moving Average should be above the price and point down;
The dot of the Parabolic SAR should be above the price;
MACD crossover downward above the ‘zero line’;
The Force Index should be point down.

Exit sell
Exit when the Parabolic SAR changes direction an is below the price, or also exit when the MACD crossover belw the ‘zero line’.


Stop Loss should be set to 20-30 pips away from the entry price for intraday trading with time frame 15 min and 30 min.

Sunday, November 29, 2015

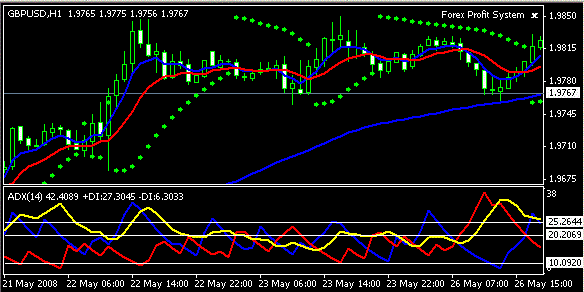
ADX filter trading

ADX filter trading is a trend following strategy based on the moving averages and ADX.
Time Frame 30min or higher
Currency pairs:any.
Setup indicators:
Three moving averages:
1. 5 exponential Moving average, close
2. 10 exponential Moving average, open
3. 80 simple moving average set to close, 80 SMA only serves as trend direction and dynamic
resistance and support points.
In sub window chart
4. Parabolic Sar set to (0,2 – 0.02) will serve as your trade direction alert.
5. ADX (14 period)
+D1 it's your buy entry signal and confirmation to enter the market
-D1 (is the sell entry confirmation.
ADX above 40 shows that the trend is strong (trending market) and profitable. ADX can also serve to indicate a divergence.
6. 4 horizontal trendlines with parameters set to 10, 20, 25 and 40 (these are optional).

Buy
1. Parabolic Sar will first indicate an uptrend with the dot below the price.
2. ADX above 20 level,
3. +D1 above 20 level,
4. -D1 below 10,
when the previous four conditions have been successfully been met, you can open an buy order.


Sell
1. Parabolic Sar will first indicate an downtrend with the dot above the price.
2. ADX above 20 level,
3. +D1 below 10 level,
4. -D1 above 20 level.
when the previous four conditions have been successfully been met, you can open an buy order.


Exit position.
They are four options:
first:
1. fixed stoploss on the previous swing, trailing stop loss and breakeven stop ( after n..pips in gain move stop loss at the entry position).

Second:
When the previous three conditions have been me


Third
EXIT PLAN THREE
1. ADX is falling below 20 level,
2. +D1 or D- go below 20 lewvel,
3. Parabolic Sar had reversed
when the previous three conditions have been met, exit to the market.

Fourth1. -D1 has cut across +D1 (below 20) and is rising up after cutting across to 20 while the +D1 is still falling (or opposite),
     2.Parabolic Sar had reversed.


.


When not to trade with this strategy, conditions:
When +D is rising above 20 level and -D1 is moving below 10 level but ADX is falling to below 25 level. Don’t trade. You can trade if ADX is rising from 15 to above 20 but not when it's trending down to below 25 level. See picuture.


when both ADX and D+ are rising to above 20 level and –D is moving to below 10 level but suddenly, one of either ADX or +D starts to trend down before the final confirmation is confirmed, don’t open trade.                                                                    


Trend continuation trading
Trend continuation first condition
1. D+ is retracing to below 20 level
2. ADX is not retracing and the
3. Parabolic Sar had not indicated a trend reversal. Stay in this trade but watch out with a stoploss.


Trend continuation second condition
Against all exist signals and confirmation, hold on to open order once –D1 is below 10 no matter what is happening at the other indicators.


Trend continuation third condition
Against all exist signals and confirmation, hold on to open order once ADX is rising above 40 and showing no sign of retracing, don’t worry about what other indicators are doing, it’s only background noise. Hold on to position but with stoploss order.


Sunday, November 22, 2015

Trend and Go trading

Trend and go is a trend-momentum strategy for intraday trading and swing.
Chart setup
If you want to setup your charts manually then you need to add the
following indicators:
- A 40-Period Exponential Moving Average of the Close price.
- A 80-Period Exponential Moving Average of the Close price.
- A 21-period CCI (Commodity Channel Index) indicator.
The second rule is that if you’re trading on the hourly chart (or any timeframe less than the hourly) – this is classed as intraday.
For this I recommend that you try and only trade between the hours of 06:00GMT and 16:00GMT. More specifically, if you can limit your trading to just 06:00GMT and 11:00GMT then your results should be even better!
If you’re trading 4-hour charts and above – it does not matter when
you trade.
So, that’s the first two rules.
The third (and final) rule is how we enter.
If the 40EMA is above the 80EMA we look to buy when:
The CCI indicator crosses from below 0.0 to ABOVE 0.0.


If the 40EMA is below the 80EMA we look to sell when:
The CCI indicator crosses from above 0.0 to BELOW 0.0.
Like this:


high to enter (in the case of a buy) – or a break of the low to enter (in the case of a sell).
So, looking at the above two charts I showed you, the level marked
‘(A)’ is where we would BUY ...and the level marked ‘(B)’ is where
we would SELL.
That’s all there is to the system!
Okay, there is a bit more like stoploss levels, take-profit target and some other things (which we’ll now cover) – but we’re about 80% or the way there!
Stoploss
The stoploss is super-simple.
We don’t place it behind any levels or such – but just enter a rough amount that will keep us “safe”.
It may not sound too strategic but it really works – especially because our stoplosses are generally smaller this way.
This is a rough guide to the size of my stoplosses on various
timeframes:
5-min 10 – 15 pips
15-min 15 – 20 pips
30-min 15 – 25 pips
Hourly 20 – 35 pips
4-Hour 30 – 50 pips
Daily 50 – 150 pips
Note: some of these may be larger or small depending on the pair
(for example, on the EUR/JPY 30-min I might use a 30 – 40 pip stoploss).
After just a few trades you will figure out the best stoploss to use for your trading.
Take Profit
Okay – the fun part – when to grab your pips!
I’ve tried many different ways of taking profit on my trades.
I’ve tried grabbing just 10 pips at a time ...I’ve tried letting my trades run for as long as I can ...and I’ve tried everything in between!
The take-profit strategy that I ended up sticking with is just taking profit at 3:1.
In other words, if my stoploss is 25 pips ...then I will set my take profit at 75 pips.
However, once price reaches 2:1 – I will move my stoploss to breakeven so that if the trade reverses against me – I lose nothing!


The Type Of Candle
The first thing I want to mention is probably the most significant thing that will boost your profits (and keep you out of bad trades!).
Although we only need to watch for when CCI crosses the 0.0-line ...we can also gain a nice advantage by watching what type of candle occurs at the same time the CCI crosses the 0.0-line.
Our ideal candle would be one that has momentum behind it – in other words, a long candle that is the same (or larger) than the few candles before it.
This type of candle shows that there is buyers (or sellers) coming into the market.
Here’s an example:
Trend and go trading


Sunday, July 19, 2015

Two line MACD with EMA's and Fibonacci retracement

This is a trend-following system based on the use of several indicators; two EMAs (Exponential Moving Averages), and the MACD (Moving Average Convergence Divergence). I will
also be using the Fibonacci Retracement tool to help determine support and The EMAs are used as opposed to the SMAs (Simple Moving Average) because I feel it provides a faster reaction to the trend. There are three main representations of the MACD; the “One-lined” MACD, which has one line overlaying the histogram; the “Two-lined” MACD, which depicts two lines overlaying the histogram; and the OsMA (short for Oscillator of the Moving Average), which displays only the histogram. In this system, we will use the two lined MACD. On the 1-hour chart, this system requires the use of the two lines of the MACD to help determine the trend, but on 5-minute chart, it only uses the Histogram. We’ll add the 7 EMA, 13 EMA and MACD (we’ll use the default settings for MACD - 12, 26, 9). 7 EMA and 13 EMA Settings:
I. Period: 7 and 13
II. Shift: 0
III. MA Method: Exponential
IV. Apply to: Close.

Find your most recent swing points to draw your Fibonacci.

Trading rules Two line MACD with EMA's

Long Trades
1. The 7 EMA needs to be above the 13 EMA on the 1 hour chart.
2. MACD should be crossed over to the up side on the 1 hour chart.
3. Find your most recent swing points and draw your Fibonacci
retracement. Wait for price to retrace to at least the 38.2% retracement
level and no more than the 78.6% retracement level on the 1 hour chart.
4. Go to your 5 min chart for entry. Ensure at least one candle on the
M5 timeframe closes below the 38.2% Fibonacci retracement level. Wait
until the MACD Histogram forms a new bar above the zero line, then
enter the market with a buy trade at the close of that candle.
5. Stops and limits can be based on previous swing highs and lows on
the five minute or hourly charts. I personally use a 15 to 20 pip stop
based on my entry point. You have to decide this based on your own
risk/reward tolerance. Never risk more than what you see as your profit
potential.

Short Trades
1. The 7 EMA needs to be below the 13 EMA on the 1 hour chart.
2. MACD should be crossed to the down side on the 1 hour chart.
3. Find your most recent swing points and draw your Fibonacci
retracement. Wait for price to retrace to at least the 38.2% retracement
level and no more than the 78.6% retracement level on the 1 hour chart.
4. Go to your 5 min chart for entry. Ensure at least one candle on the
M5 timeframe closes above the 38.2% Fibonacci retracement level. Wait
until the MACD Histogram forms a new bar below the zero line, then
enter the market with a sell trade at the close of that candle.
5. Stops and limits can be based on previous swing highs and lows on
the five minute or hourly charts. I personally use a 15 to 20 pip stop
based on my entry point. You have to decide this based on your own
risk/reward tolerance. Never risk more than what you see as your profit
potential.

Fibonacci Retracement
After you have determined your trend as depicted by the EMAs and the MACD,
you want to look for your most recent swing points (swing-highs & swing-
lows). A swing-high is the highest point of the highest candle in a price
movement. A swing-low is the lowest point of the lowest candle or bar in a
price movement. In other words, a swing-high candle must be preceded by a
candle that has its high point lower AND the subsequent candle must also
have its high point lower. Conversely, the swing-low candle must be preceded
by a candle that has its low point higher AND the subsequent candle must also
have its low point higher. The Fibonacci tool is then used to determine a higher
probability retracement once the swing-low and swing-high are established. A
minimum retracement of 38% is required, as seen in the chart below:
Two line MACD with EMA's and Fibonacci retracement

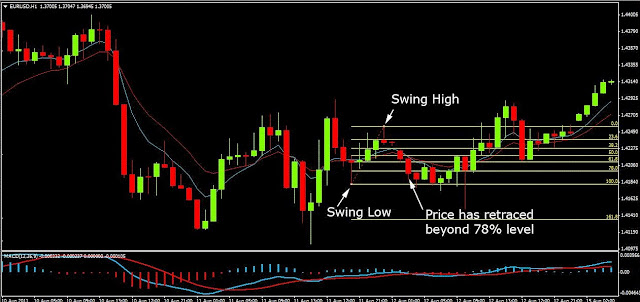
A few candles earlier from the chart above, we see that the EMAs came into
bullish alignment, as well, however, once the Fib tool was applied to the chart,
we see that the market continued to retrace beyond the 78% level nullifying
the move as seen below:
Two line MACD with EMA's and Fibonacci retracement


However, as we patiently waited for market movement, we see that the bullish
trend reaffirmed (EMAs and MACD re-aligned) and subsequently retraced to
an appropriate level:


Entry
Once the requirements for determining the trend have been satisfied on the
1-hour chart, I drop down to the 5-minute chart to pin-point my entry. Only
the MACD Histogram is used at this time. When a histogram bar pops up from
below the zero line, this signals a bullish entry. A bearish entry is confirmed
when a histogram bar appears below the zero. Also, please take note, in my
videos, I often times refer to the “zero line” as the “water line”.
Remember, the 1-hour chart is used to determine the trend,
and only the 5-min chart is used for the actual entries.
Below is an example of a 5-min entry signal:


Short/Sell Trade Examples
EURUSD
The 1 Hour Chart


The 7 EMA is below the 13 EMA. The MACD is crossed down at point (A). All
points are marked on the chart. Find your most recent swing points to
measure your Fib retracement from. I have drawn my Fib Line using the most
recent swing points.
Price has retraced above 50% and
The 5 Min Chart


At point C the histogram has gone below the zero line. At point D enter short
at the close of that candle, because the histogram has gone below the zero
line. Point D marks the entry. Your limit can be the previous swing low on the
1 hour chart or a pivot point. Your stop can be a previous swing high on the 1
hour chart or a pivot point. You have to decide that based on your risk vs.
your reward. Price fell over 100 pips.
Buy/Long Trade Examples
GBPUSD
The 1 Hour chart


The 7 EMA is below the 13 EMA. The MACD is crossed down at point (A). All
points are marked on the chart. Find your most recent swing points to
measure your Fib retracement from. I have drawn my Fib Line using the most
recent swing points.
Price has retraced above 50%  


At point C the histogram is above the zero line. At point D enter long at the
close of that candle, because the histogram is above the zero line. The arrow
at point D marks the entry. Your limit can be the previous swing high on the
1 hour chart or a pivot point. You have to decide that based on risk vs. reward.
Price went up over 100 pips.  

Monday, April 13, 2015

Eagle Trading System

Eagle trading System is a trend following system based on moving averages and ADX (Average Directional Movent Index).
Time Frame 15 min, 30min, 60 min, 240 min.
Markets: Currencu Pairs (majors) and Index.
Indicators:
Exponential Moving Average 16 period, close;
Simple moving average 200, close;
Average Directional Movent Index 14 period close (with level 23).
trading Rules for Eagle Trading System

Buy
16 EMA cross up SMA 200 ;
ADMI is above 23 level.

Sell
16 EMA cross down SMA 200 ;
ADMI is above 23 level.
Profit target 20-40 pips
Stop loss 20-30 pips.

Tips: Eagle trading system is good for intraday trading.

Eagle Trading System

Eagle Trading System


Sunday, April 12, 2015

Three shorts moving averages crossover

Three shorts moving averages crossover is an trading systems based on fast exponentials  moving averages are simple and easy for make trading. 
Markets: Currency pair, Indicies. 
Time frame chart: 15 min chart, or higher.
Indicators: 9 EMA, 21 EMA, 50 EMA. 

Trading rules:
Buy
9 EMA goes above 21 EMA and 50 EMA.
Sell
9 EMA goes below 21 EMA and 50 EMA.

Exit position rules:
exit when 9 EMA crosses 21 EMA in opposite direction.
Make profit on the support or resistance line or pivot point.
Place initial stop loss on the previouis swing High/Low.
Advantages: it is simple to use, and it make interesting results in trending market or during big price breakouts .
 Disadvantages: during the sideways market  with little fluctuation of the price this strategy give many false signals.
Solution: find the market in trend following and apply this trading system and trades only in the direction of the trend.
Three shorts moving averages crossover is a classic trading strategy.


Three shorts moving averages crossover

Three shorts moving averages crossover


Friday, March 27, 2015

Slow Turtle System


Turtle trading system originally developed by Richard Dennis and William Eckhardt and now being used by possibly hundreds of hedge funds to manage currencies, stocks, and commodities.
They made a bet and then used very minimal criteria to select a group of students to teach.
These students became the original “turtles” (named after the Turtle system that they were taught) and most of them went on to manage fairly impres- sive funds. All of them were sworn to secrecy about the details of the original system. However, I doubt at this point any of them use that original
system and if they do, it is certainly not the version we want to be using, the Turtles trade trends.
Basically, if a commodity or stock is breaking to new highs, the idea is that that momentum should continue and you should just ride the asset until it is no longer making new highs. By trading a basket of uncorrelated markets, you can take advantage of the fact that at any given point, some where in the financial universe, something is in a bull market.
Trend-following can offer huge returns. If you catch close to the beginning of a huge bull move in a market, the returns on that trade can be multiples of 100 percent. Similarly, the drawdowns can be enormous. Dennis himself has gone in and out of the hedge fund business several times, most recently closing shop in 2000, primarily because his drawdowns have been immense and clients have withdrawn money. The key to success in a trend-following system is not in picking the right entries and exits, but merely staying in the game to be able to withstand the drawdowns. That said, if one chooses a basket of assets carefully so that they are as uncorrelated as possible, it may be possible to smooth out drawdowns. We will see a simple example of that possibility in a bit.
The version presented here is based onone told to me by a manager of a multibillion-dollar trend-following fund. Al-though most of the systems presented in this book are short-term countertrend systems, I do think a properly diversified trading strategy should
include some trend-following component. This is the system I currently use:
Buy if an asset’s 22-week closing simple moving average crosses over its 55-week closing moving average; buy at the market open the next
Monday.
Sell if an asset’s 22-week closing simple moving average crosses under its 55-week closing moving average; sell at the market open the next Monday.
Note the simplicity of the method. The more complicated a system is, the more likely it is to suffer from severe curve fitting. Basically, I am not as interested in using complicated methods from quantum mechanics to identify trends. If an asset is moving up so that its slow- and fast-moving av-
erages are moving up, then I am happy to say it is trending.
Why no shorting? As we have seen in Technique 5, shorting is not necessarily the opposite of going long. Along with the fact that the markets have a natural bias to move upward over the past one hundred years, your upside is also capped at a 100 percent. When following a long-term trend following system, it is possible to have trades that make well over 100 percent. Also, if you choose your basket of assets correctly, you can be going long some assets, while other assets are on their downtrends.
EXAMPLES
S&P 500, June 1958 to June 1961
The lowest line in Figure 1 represents the 55-week moving average. The line directly above it represents the 22-week exponential moving average.

On June 23, 1958, the lines crossed, and we bought at the open of the next week holding until the bottom line crossed under on May 2, 1960, when we closed out the trade for a 19.6 percent profit. The market seesawed for a year or so afterwards before we bought again on January 3, 1961, at the start of the next bull market that lasted throughout the 1960s.
Slow Turtle System
Slow Turtle System
S&P 500, July 1987 to May, 2003
Of course, no trend-following system would be worth its weight in salt if it did not capture the trend that occurred throughout the 1990s as shown in Figure 7.2. As seen in the figure, the system was long the market from February 19, 1991, right after the Gulf War, until December 11, 2000, for a 271 percent return. (Also see Table 7.1, Table 7.2 , and Table 7.3 .
You can, of course, run this system on stocks. Table 7.3 shows the results of the system on Nasdaq 100 stocks, starting with $1M and using 2 percent of equity per trade. The system was almost always in the market and had, of course, its equity peak at the peak of the bull market in 2000 (see Figure 3, ).
Figure 4 shows the annual returns of the system.
Using the Turtle system on stocks, you would have been able to maximize the advantages of the bull market while keeping drawdowns some what low in the bear market even though they existed. Notably, despite being a horrible year for the broader market, 2001 was up 8 percent in this
system. The annual returns are shown in Table 4.
Results for Turtle System on the S$P 500
  
S&P 500 Weekly chart Turtle System
  
Trades for slow Turtle on S&P 500
Looking at Figure 5 , an analysis of the maximum adverse excursion (the amount a trade went negative before closing out), the light gray trades represent the trades that eventually were closed out as profitable trades but underwent a drawdown in the process. One trade was as much as 40 percent down before returning to profitability, and 17 trades were between 20 percent and 40 percent down before returning to prof- itability. We can see in the results that the maximum drawdown from peak to low was slightly over 58 percent. Nevertheless, this system greatly out performed the market from 1998 to 2003 and was able to benefit massively during extreme bull market moves. Again, having a trend-following system in your arsenal is an important weapon in addition to the various countertrend systems we have demonstrated in this book.
Simulation of Slow Turtle on the Nasdaq 100


Figure 4 Slow Turtle
Figure 4 Slow Turtle 

Figure 5 Slow Turtle Winning Trades


Wednesday, March 25, 2015

EMA's 5, 13, 62, Trading

Exponential Moving Averages (described in more detail below) are at the core of tis strategy. From the beginning you should understand that I didn’t invent the 5/13/62 strategy. At least I don’t think I did. There are some extras that I add in, but essentially, all of this information is available elsewhere. That said, I believe that most of the people that write about forex have a way of putting you and I to sleep. So maybe this is the first time you’ve heard about it, but in any event, I’ll try to
keep it interesting.

Here’s where we start. With a chart:
EMA's 5, 13, 62, Trading
If the chart above doesn’t make any sense to you, even with the legend, then here’s a brief explanation:
1. The candles are easy to read. Green ones are ones that closed lower. White ones closed higher.
2. The EMA lines are crossing at the left. The 5 (red) crosses below the 13 (the yellow) and both the 5 and 13 are crossing the 62 (the blue one).
3. You can see that in this chart, the British Pound fell about 110 pips in less than a day. That’s the chart. What can we learn immediately?
1. When the 5 crosses below the 13, and both of them cross below the 62, it’s possibly a good sell signal.
2. Inversely, we can assume that the opposite is true: when the 5 crosses above the 13, and both cross above the 62, it’s a buy signal.
What is the EMA?
Moving averages are the average value of the price of a currency pair, over a certain period of time. A 5-day moving average for the EUR/USD would be the average price of the EUR/USD over a 5 day period. You can base the average on the closing, opening, or other price. Each time the MA is calculated, the earliest period is dropped and the latest period is added. In this way, the average price fluctuates according to the fixed time period.
The exponential moving average (EMA) puts the emphasis on the most recent prices, and less emphasis on the older prices. Sometimes you won’t see much difference between the EMA and the Simple Moving Average, which does not weigh any price more than another.

Is that it? Do I just look for the crosses?
I have backtested (and so have many, many others) simply buying when the signals cross above and selling when the signals cross below.
There are even companies that build trading robots that will automatically buy and sell when these signals are given. But, as much as I’d like to say differently, it’s not that easy.
There are all types of false signals (crosses that happen but that don’t turn profitable).
Here are some other principles of this strategy, divided in three sections: entering the trade, staying in the trade, exiting the trade. The principles of each section will help you maximize your gains and
minimize your losses. But first, a quick look at the tools you’ll need.

The 30 minute chart
I have used the 15 minute, 30 minute, 1hr, 4hr, daily … even the weekly chart. You can really use anything longer than 15 minutes. I recommend starting with the 15 minute or the 30 minute, so you will see more opportunities in a shorter period of time.
The 5 and the 13 alone Chart the 5, the 13, and the 62 period Exponential Moving Averages.

Making the Trade
Below you’ll find the principles behind making good trades. And avoiding the bad ones. These are guidelines. Good trades based on these guidelines are the result of applying them enough times that you begin to get a feel for the market. I want to emphasize that you can change these rules. You can
manipulate them. You will be most successful when you make this “your own,” by adjusting so that you feel most comfortable.
Holidays and other bad days
Try not to trade on holidays, especially U.S. holidays. It’s best to stay out of the market on those days and catch up on time with your family, see a movie, adjust the metal rod that was placed in your back, insert a metal rod in your back, or fire up the barbie-q and roast some weenies. Or you can back test your strategies. It’s also best to never, ever, ever, enter a trade past 14:00 GMT on a Friday. On holidays and late on Fridays, the market is unpredictable and might not move enough to give you any profit. Or it might move 50 points in one direction just for the heck of it, and then move back. Of course it might move a zillion pips, but that’s the exception rather than the rule. Then you’re stuck in what might become a losing position, but meanwhile, you’re losing money to premiums/interest paid to your broker. This is a good time to shove a metal rod into your spine.
Please take my advice and just stay out of the market, with this system, at these times. You may lose some opportunities, but you will lose (also) the chance of getting trapped in a motionless or unpredictable market.
Other systems, long term systems in particular, can work okay late on Fridays and on holidays. But that is the subject of another ebook.
One, incidentally, that I have not written yet. Trading on the 5 and the 13 You should be prepared to buy anytime the 5 crosses above the 13.
You should also be prepared to sell anytime the 5 crosses below the 13. You should be prepared to do this even if they do not simultaneously cross the 62. This does not mean that you take the trade immediately. It means that you are aware that a trade might be coming.

Is the currency pair in a DNA Spiral?
Often, a currency pair will find itself in the middle of what I call a DNA Spiral. It’s when the pair doesn’t know what to do – it just sits in a very, very tight range, like this:
EMA's 5, 13, 62, Trading

As you can see, the red (5) is crossing above and below the 13 (yellow), but the signal is false – you wouldn’t make any money on these trades because, as soon as the cross occurs, it corrects itself in the opposite direction. It’s obviously best to stay out of the market on these occasions. So, if you walk up to your PC and see these DNA Spirals, make trades cautiously. If you enter the trade, then stay close to the computer and prepare to get out if the market really swings the other way.

Is the 13 crossing the 62?
The next part of the system is to watch for the 13 to cross the 62. Whether above or below (long or short positions), you’re in good territory. At these times, it might be a very, very good opportunity.
An example of what the chart looks like when this happens is pictured on the next page.
As you can see in the pink box in the chart below, the 5 (red) is crossing below the 13 (yellow) at the same time the 13 is crossing below the 62 (blue). This can be very powerful. I want you to also focus on the fact that the pair, after this crossover occurs at the pink circle, return to hit the 62 EMA again – and this is an excellent time to sell the pair all over again. This means that if you miss the original trade, it’s totally acceptable to enter the trade when the pair rises up and hits the 62.
You can see an example of this in the blue box on the chart below. This works for long and short trades – the 62 EMA will act as a dynamic level of support and resistance.
Stops and limits
Last of all, do the following:
1. Set a stop-loss at 20 pips beyond the 62 EMA.
2. Trail the trade by 20 pips (using a trailing stop loss), or:
3. Set a profit target at a recent high or low (something that creates a double top or double bottom).

During the Trade
Lots can happen during the trade. Here are some things to consider and remember during the trade.
Set it and forget it?
believe that anyone that tells you to “Set it and forget it” is appealing to your desire for quick, easy profits without any work. Right now, I would like to appeal to your desire for quick and easy profits without any work. I will do this by telling you that if you choose a recent high/low as your profit target, or a trailing stop, then you can walk away. Walking away gives you time to spend with your family, work on your computer, take out the trash, wash the dog, or start a rock band named “The PipMeisters,” with me playing the drums and this guy with really long hair at lead vocals, who smokes so his voice can be really raspy, but has family problems and sometimes has to spend the night in jail, which eventually breaks up the band and leaves us 10 years later looking a photos and saying, “Those were the days when we could rock soooo hard.” If this disappoints you, or if you don’t know if a rock band is right for you, then feel free to watch the trade while it’s open.
That’s ok too. Although many traders have experienced problems with peeing in their pants while trades are open. Of course that’s not a problem for you. Or me. Definitely not me.
Initial volatility
At the beginning of the trade, you might see some initial volatility. This means that after the candle closes, you might see the next candle go opposite from where you want it to be. Don’t get overly concerned about this. You need at least 20 pips of free room to let the trade gather momentum. And remember what I said (not about the rock band): the pair might rise up or fall down and hit the 62 EMA. This is just another opportunity to get in the trade if you did not already (or add to your position).
Exiting the Trade
We already covered this, because you set the limit at a recent high or low, or you set a 20 pip trailing stop. Let the system exit the trade for you, based on your stops and limits. Most forex dealers will guarantee stops and limits, so you’ve got little to worry about.


Tuesday, November 25, 2014

50 EMA with trend line breakout

50 Ema with trend line breakout is a trend following system with price action analysis.
This system is super-simple and can be used on ANY timeframe.
Markets: Forex and Indicies.
The system uses a 50sma for trend direction – then we just watch, visually, for a mini-trendline to form – we then enter when the trendline ‘breaks’.
Top Tip: Trading this system on 5-minute charts during the London session can result in some big winners.

Trading rules 50 EMA with trend line breakout

Buy
When price is above 50SMA and price breaks up mini trend line.
Sell
When price is below 50SMA and price breaks down mini trend line.

Exit Position
Profit Target Ratio Stop loss 1:1 .
Place initial Stop Loss on the previous swing High/Low.
50 EMA with trend line breakout


50 EMA with trend line breakout